"""
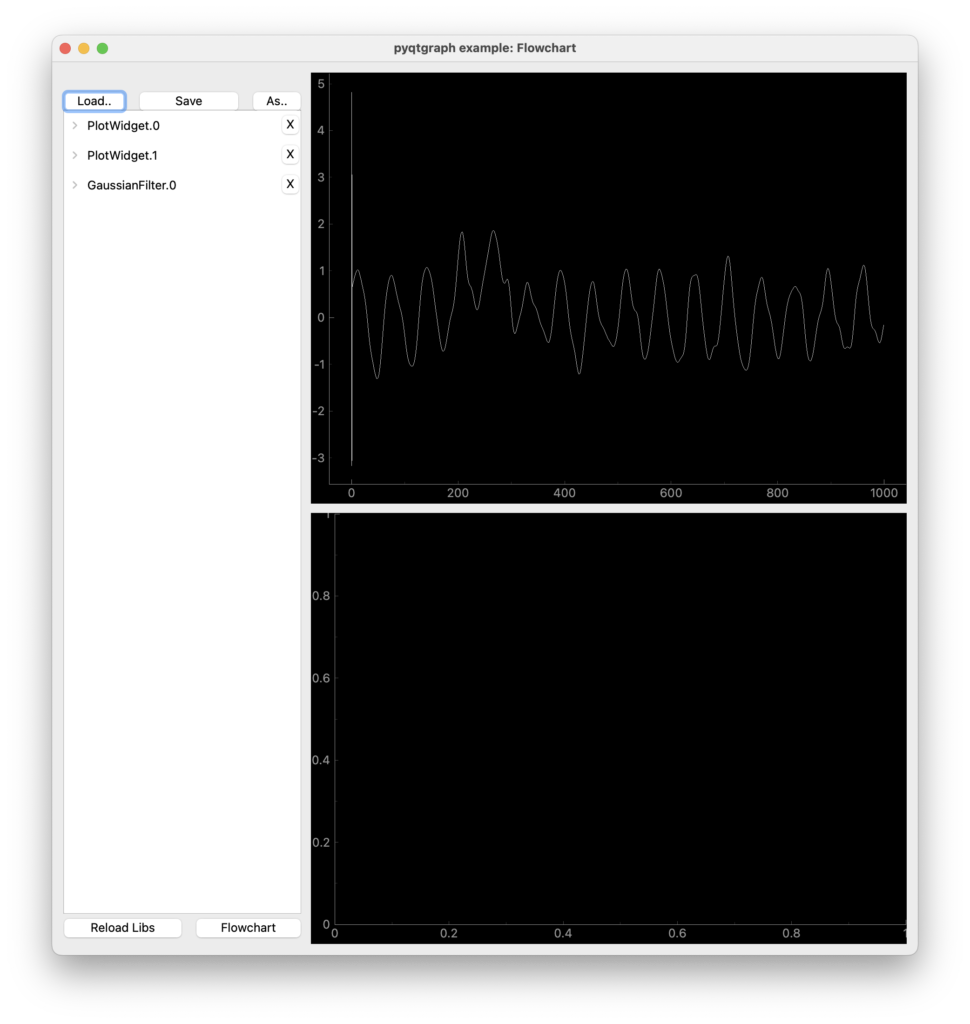
This example demonstrates a very basic use of flowcharts: filter data,
displaying both the input and output of the filter. The behavior of
the filter can be reprogrammed by the user.

Basic steps are:
  - create a flowchart and two plots
  - input noisy data to the flowchart
  - flowchart connects data to the first plot, where it is displayed
  - add a gaussian filter to lowpass the data, then display it in the second plot.
"""

import numpy as np

import pyqtgraph as pg
import pyqtgraph.metaarray as metaarray
from pyqtgraph.flowchart import Flowchart
from pyqtgraph.Qt import QtWidgets

app = pg.mkQApp("Flowchart Example")

## Create main window with grid layout
win = QtWidgets.QMainWindow()
win.setWindowTitle('pyqtgraph example: Flowchart')
cw = QtWidgets.QWidget()
win.setCentralWidget(cw)
layout = QtWidgets.QGridLayout()
cw.setLayout(layout)

## Create flowchart, define input/output terminals
fc = Flowchart(terminals={
    'dataIn': {'io': 'in'},
    'dataOut': {'io': 'out'}
})
w = fc.widget()

## Add flowchart control panel to the main window
layout.addWidget(fc.widget(), 0, 0, 2, 1)

## Add two plot widgets
pw1 = pg.PlotWidget()
pw2 = pg.PlotWidget()
layout.addWidget(pw1, 0, 1)
layout.addWidget(pw2, 1, 1)

win.show()

## generate signal data to pass through the flowchart
data = np.random.normal(size=1000)
data[200:300] += 1
data += np.sin(np.linspace(0, 100, 1000))
data = metaarray.MetaArray(data, info=[{'name': 'Time', 'values': np.linspace(0, 1.0, len(data))}, {}])

## Feed data into the input terminal of the flowchart
fc.setInput(dataIn=data)

## populate the flowchart with a basic set of processing nodes.
## (usually we let the user do this)
plotList = {'Top Plot': pw1, 'Bottom Plot': pw2}

pw1Node = fc.createNode('PlotWidget', pos=(0, -150))
pw1Node.setPlotList(plotList)
pw1Node.setPlot(pw1)

pw2Node = fc.createNode('PlotWidget', pos=(150, -150))
pw2Node.setPlot(pw2)
pw2Node.setPlotList(plotList)

fNode = fc.createNode('GaussianFilter', pos=(0, 0))
fNode.ctrls['sigma'].setValue(5)
fc.connectTerminals(fc['dataIn'], fNode['In'])
fc.connectTerminals(fc['dataIn'], pw1Node['In'])
fc.connectTerminals(fNode['Out'], pw2Node['In'])
fc.connectTerminals(fNode['Out'], fc['dataOut'])

if __name__ == '__main__':
    pg.exec()
"""
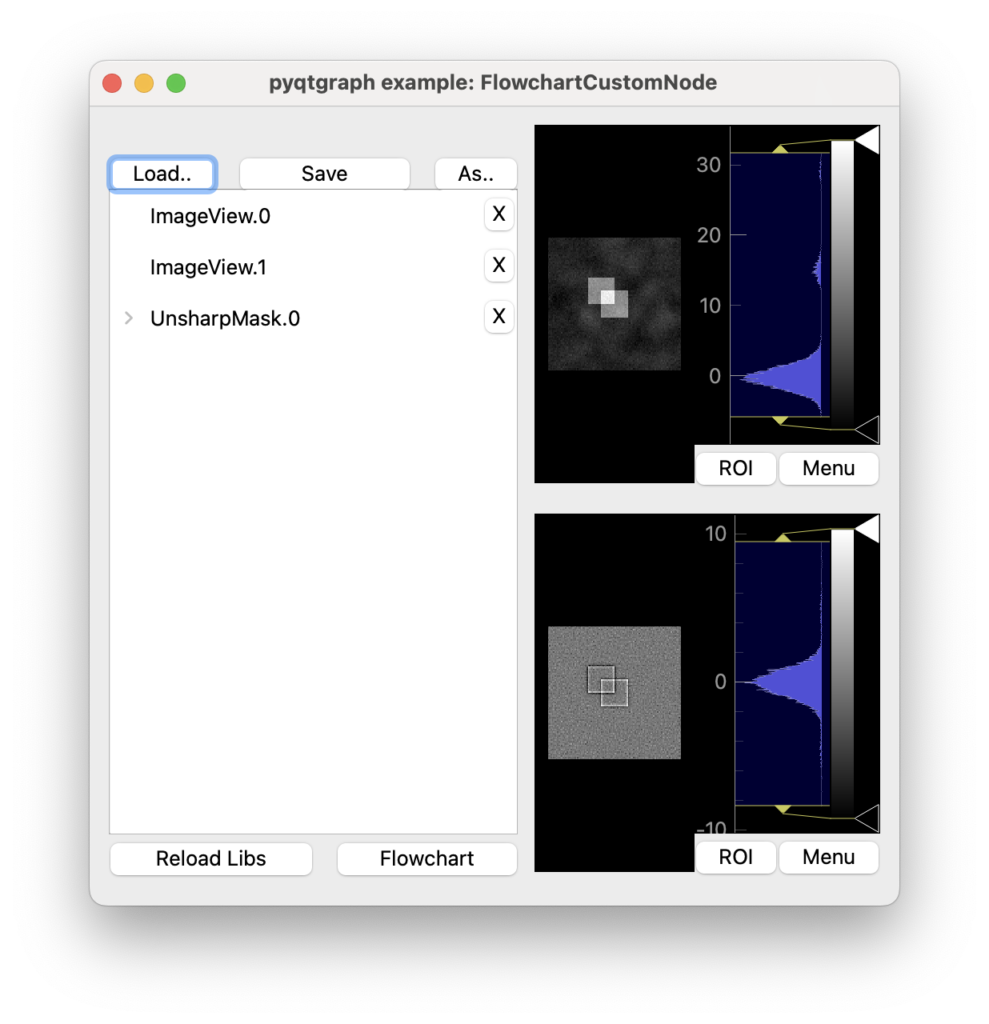
This example demonstrates writing a custom Node subclass for use with flowcharts.

We implement a couple of simple image processing nodes.
"""

import numpy as np

import pyqtgraph as pg
import pyqtgraph.flowchart.library as fclib
from pyqtgraph.flowchart import Flowchart, Node
from pyqtgraph.flowchart.library.common import CtrlNode
from pyqtgraph.Qt import QtWidgets

app = pg.mkQApp("Flowchart Custom Node Example")

## Create main window with a grid layout inside
win = QtWidgets.QMainWindow()
win.setWindowTitle('pyqtgraph example: FlowchartCustomNode')
cw = QtWidgets.QWidget()
win.setCentralWidget(cw)
layout = QtWidgets.QGridLayout()
cw.setLayout(layout)

## Create an empty flowchart with a single input and output
fc = Flowchart(terminals={
    'dataIn': {'io': 'in'},
    'dataOut': {'io': 'out'}
})
w = fc.widget()

layout.addWidget(fc.widget(), 0, 0, 2, 1)

## Create two ImageView widgets to display the raw and processed data with contrast
## and color control.
v1 = pg.ImageView()
v2 = pg.ImageView()
layout.addWidget(v1, 0, 1)
layout.addWidget(v2, 1, 1)

win.show()

## generate random input data
data = np.random.normal(size=(100,100))
data = 25 * pg.gaussianFilter(data, (5,5))
data += np.random.normal(size=(100,100))
data[40:60, 40:60] += 15.0
data[30:50, 30:50] += 15.0
#data += np.sin(np.linspace(0, 100, 1000))
#data = metaarray.MetaArray(data, info=[{'name': 'Time', 'values': np.linspace(0, 1.0, len(data))}, {}])

## Set the raw data as the input value to the flowchart
fc.setInput(dataIn=data)


## At this point, we need some custom Node classes since those provided in the library
## are not sufficient. Each node will define a set of input/output terminals, a
## processing function, and optionally a control widget (to be displayed in the
## flowchart control panel)

class ImageViewNode(Node):
    """Node that displays image data in an ImageView widget"""
    nodeName = 'ImageView'

    def __init__(self, name):
        self.view = None
        ## Initialize node with only a single input terminal
        Node.__init__(self, name, terminals={'data': {'io':'in'}})

    def setView(self, view):  ## setView must be called by the program
        self.view = view

    def process(self, data, display=True):
        ## if process is called with display=False, then the flowchart is being operated
        ## in batch processing mode, so we should skip displaying to improve performance.

        if display and self.view is not None:
            ## the 'data' argument is the value given to the 'data' terminal
            if data is None:
                self.view.setImage(np.zeros((1,1))) # give a blank array to clear the view
            else:
                self.view.setImage(data)


## We will define an unsharp masking filter node as a subclass of CtrlNode.
## CtrlNode is just a convenience class that automatically creates its
## control widget based on a simple data structure.
class UnsharpMaskNode(CtrlNode):
    """Return the input data passed through an unsharp mask."""
    nodeName = "UnsharpMask"
    uiTemplate = [
        ('sigma',  'spin', {'value': 1.0, 'step': 1.0, 'bounds': [0.0, None]}),
        ('strength', 'spin', {'value': 1.0, 'dec': True, 'step': 0.5, 'minStep': 0.01, 'bounds': [0.0, None]}),
    ]
    def __init__(self, name):
        ## Define the input / output terminals available on this node
        terminals = {
            'dataIn': dict(io='in'),    # each terminal needs at least a name and
            'dataOut': dict(io='out'),  # to specify whether it is input or output
        }                              # other more advanced options are available
                                       # as well..

        CtrlNode.__init__(self, name, terminals=terminals)

    def process(self, dataIn, display=True):
        # CtrlNode has created self.ctrls, which is a dict containing {ctrlName: widget}
        sigma = self.ctrls['sigma'].value()
        strength = self.ctrls['strength'].value()
        output = dataIn - (strength * pg.gaussianFilter(dataIn, (sigma,sigma)))
        return {'dataOut': output}


## To make our custom node classes available in the flowchart context menu,
## we can either register them with the default node library or make a
## new library.


## Method 1: Register to global default library:
#fclib.registerNodeType(ImageViewNode, [('Display',)])
#fclib.registerNodeType(UnsharpMaskNode, [('Image',)])

## Method 2: If we want to make our custom node available only to this flowchart,
## then instead of registering the node type globally, we can create a new
## NodeLibrary:
library = fclib.LIBRARY.copy() # start with the default node set
library.addNodeType(ImageViewNode, [('Display',)])
# Add the unsharp mask node to two locations in the menu to demonstrate
# that we can create arbitrary menu structures
library.addNodeType(UnsharpMaskNode, [('Image',),
                                      ('Submenu_test','submenu2','submenu3')])
fc.setLibrary(library)


## Now we will programmatically add nodes to define the function of the flowchart.
## Normally, the user will do this manually or by loading a pre-generated
## flowchart file.

v1Node = fc.createNode('ImageView', pos=(0, -150))
v1Node.setView(v1)

v2Node = fc.createNode('ImageView', pos=(150, -150))
v2Node.setView(v2)

fNode = fc.createNode('UnsharpMask', pos=(0, 0))
fc.connectTerminals(fc['dataIn'], fNode['dataIn'])
fc.connectTerminals(fc['dataIn'], v1Node['data'])
fc.connectTerminals(fNode['dataOut'], v2Node['data'])
fc.connectTerminals(fNode['dataOut'], fc['dataOut'])

if __name__ == '__main__':
    pg.exec()


コメント